
The AMI SA Galactic Plane Survey
Introduction
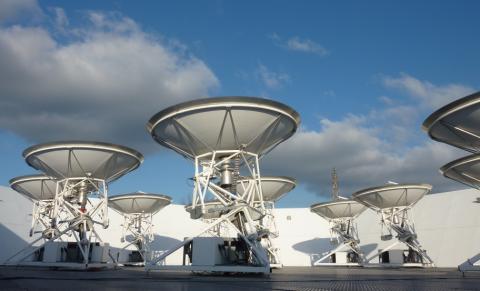
The 15.7-GHz, AMI Galactic Plane Survey has been carried out using the Arcminute Microkelvin Imager (AMI) Small Array (SA), which is operated by the Cavendish Astrophysics Group at Lord’s Bridge, Cambridgeshire. The SA is one of the two AMI arrays (see Zwart et al. 2008 for detailed technical information about AMI); it is a radio synthesis telescope comprising ten 3.7-metre-diameter dishes and is used to observe between frequencies of 13.5 and 18.0 GHz with a resolution of approximately 3 arcmin. The SA is optimised for detecting extended Sunyaev-Zel’dovich effects on arcminute scales, but is also used extensively for Galactic astronomy.
The first AMIGPS data release (DR-I) consisted of ≈ 868 sq. degrees between 76° < l < 170°, |b|<5°. Maps and catalogues from this data release are available here and are described in Perrott et al, 2013.
The full data release (DR-II) is now available (see Perrott et al 2015), extending the area of the survey to ≈ 1777 sq. degrees, covering 53° < l < 170°, |b|<5° plus higher-latitude extensions to cover the Taurus and California giant molecular cloud regions and the recently-discovered large-scale supernova remnant G159.6+7.3; the coverage in equatorial and Galactic coordinates is shown below. The data have also been reprocessed with an improved reduction pipeline.


The AMIGPS catalogue is available in ASCII and FITS formats. The accompanying README file provides information about the various parameters contained in the catalogue.
The AMIGPS raster maps are available below. The maps are in FITS format in Galactic coordinates. Each link below is a tarball containing:
- The map;
- A noise map showing the estimated thermal noise level at every pixel;
- An adjusted noise map showing (flux density detection threshold)/5 at each pixel, accounting for exclusion zones around bright sources – see paper for more detail.
Main survey (6° x 6° maps)
Taurus extension (≈ 8.5° x 8.5° maps)
| l (°) | b (°) |
|---|---|
| 168.68 | -17.28 |
| 171.81 | -13.89 |
| 172.15 | -20.47 |
| 174.84 | -10.29 |
| 175.49 | -16.93 |
| 177.65 | -6.43 |
| 178.62 | -13.14 |
| 180.09 | -2.56 |
| 181.52 | -9.21 |
| 184.21 | -5.17 |
California molecular cloud extension (≈ 11.5° x 11.5° maps)
| l (°) | b (°) |
|---|---|
| 160.52 | -10.08 |
| 165.28 |
G159.6+7.3 extension (≈ 10° x 10° maps)
| l (°) | b (°) |
|---|---|
| 157.32 | +5.01 |
| 160.92 |
Last modified 27 Aug 2015
Yvette Perrott (ycp21@mrao.cam.ac.uk)