
AMI Science
Galaxy Clusters
Observations of galaxy clusters are central to the AMI science programme. The AMI Small Array is used to observe already-known clusters with high-sensitivity and resolution, allowing us to extract detailed information about individual clusters and to build up statistics about the cluster population. The telescope is also used to carry out high-sensitivity surveys, in an attempt to discover previously-unknown clusters, which can then be targeted with further follow-up observations.
Observing galaxy clusters at 15 GHz is tricky because of the contamination from foreground radio sources, which is where the Large Array comes in! When the Small Array is used to carry out an observation of a cluster or to survey a particular patch of sky, the Large Array is used to carry out simultaneous observations towards the same target. The Small Array is designed to be sensitive to scales of a few arcminutes on the sky – perfect for observations of galaxy clusters. On the other hand, the Large Array has higher resolution, so it’s well-suited to carrying out observations of the emission from the extragalactic point sources, which contaminate the Small Array observations. By using the Large Array measurements, we are able to subtract the foreground point sources from the maps created from the Small Array data to reveal the galaxy clusters!
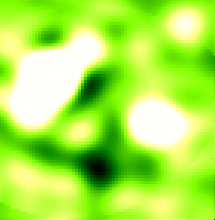
Small Array map of A1758 before source subtraction. The areas of lightest shading indicate the emission from foreground radio sources.
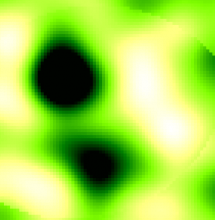
Small Array map of the same cluster after the emission from the foreground radio sources has been subtracted using data from Large Array observations. The dark feature is the cluster.
The first AMI blind cluster
AMI has been busy carrying out a survey of several patches of the northern sky. By surveying these areas to low noise levels, we hope to detect a number of previously undiscovered clusters. The complete AMI catalogue will provide an unbiased sample of galaxy clusters that will be used to address many of the big questions in cosmology. We will focus on constraining the matter density of the Universe, exploring the evolution of galaxy clusters and studying the dark energy equation of state.
We have recently analysed data from our first survey field, detecting AMI’s first blind galaxy cluster. Once the contamination from foreground radio sources has been removed, it is apparent that this galaxy cluster is a complex merging system, consisting of two distinct cluster components. We calculate that each of these interacting clusters has a mass between 200 and 500 million million times that of the Sun and a temperature of around 70 million kelvin (approximately 10,000 times the temperature of the Sun’s corona). These masses and temperatures are typical for these giant structures, which can contain hundreds of galaxies and many billions of stars.
The Bullet-like cluster
The Bullet-like cluster is a very exciting merger between two cluster systems. Galaxy clusters grow and evolve by interacting with smaller subsystems. During a merger these subclusters collide at relative velocities of thousands of kilometres per second and release gravitational binding energies of ∼ 1057 Joules (∼ 1037 times the World’s total annual energy consumption!), making them unique environments to study the dynamics of matter under extreme conditions. In the case of the Bullet-like cluster, otherwise known as Abell 2146, a smaller cluster entered the main cluster between 0.1 and 0.3 billion years ago, producing some of the most supersonic shock fronts ever seen!
AMI has been used to observe the Bullet-like cluster. The data that were collected allowed us to calculate the cluster mass, temperature and radius. The AMI observations also revealed that the gas and dark matter within the cluster seem to be significantly displaced from one another – an effect of the cluster merger. Interestingly, the X-ray and SZ signals appear to be extended in directions almost perpendicular to one another, an effect that has been predicted by some computer simulations.
The SZ effect gives us information about the gas content of galaxy clusters. Gas contributes about 25% of the total mass of these objects. Most of the remaining mass is believed to be in the form of dark matter, which can only be detected by its gravitational effects. Galaxy clusters are so massive that they are able to form gravitational lenses – they bend the light of background galaxies around them, changing their apparent distribution and elongations. By studying the effect of the cluster on thousands of background objects we can work out its shape.
By combining weak-lensing data with information on the gas distribution from AMI SZ data, we can see how relaxed a galaxy cluster is and whether any interesting merging events are taking place. The two methods are also complementary because they both measure clusters on large scales and are not biased toward strong concentrations of mass or gas.

A composite (lensing, SZ and X-ray data) image of the massive galaxy cluster Abell 1914, further details of which are available in AMI Consortium: Hurley-Walker et al. (2011).
Source Surveys
For over 50 years, the radio telescopes at Cambridge have been used to carry out surveys of radio sources, providing astronomers with an invaluable resource for the study of the Universe. For example, the 3C (Third Cambridge) Survey, published in 1959, provided strong evidence in support of the Big Bang theory, which was not widely accepted at that time. Later, the 6C survey, carried out during the 1980s and 90s, was to become the defining low-frequency radio survey. More recently, the 9C Survey was used to shed new light on the high-radio-frequency sky; it was the first survey of any significant extent and depth at such a high radio frequency.
The AMI Large Array, is currently being used to carry out the 15.7-GHz 10C Survey. The survey builds on the work carried out as part of the 9C Survey. It is concentrating on a smaller area but is observing to much lower noise levels, allowing us to detect objects about ten times fainter than before. The first data, from a 27 sq. degree (roughly 125 times the size of the Full Moon) patch of sky, from the 10C Survey were recently released. The catalogue for this first data release contains almost 2000 individual objects. We now plan to learn more about the properties of these radio sources by studying them in greater depth by, for example, observing them at different radio frequencies.
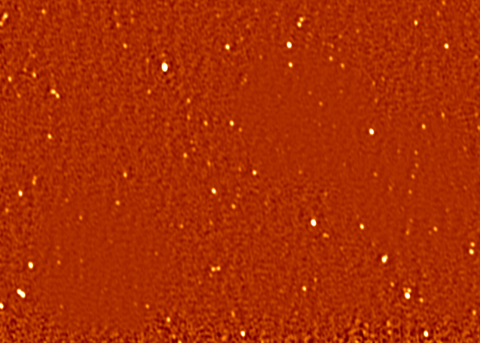
A 10C Survey map of a portion of one of the survey fields. The radio sources are clearly identifiable.
Galactic Science
Supernova Remnants
When a massive star has exhausted its supply of hydrogen fuel it enters the final stages of its life, eventually erupting into a massive supernova. The outer layers of the star are cast off at extremely high velocities – as high as 1% of the speed of light. As the material expand outwards, into the surrounding interstellar medium, it causes huge pressure shocks and heats the gas up to millions of degrees. As these remnants continue to expand they cool and their spectra and morphology changes. As a result, observations of supernova remnants can reveal the time of the original explosion.
Most of the signal from supernova remnants across the AMI frequency band arises from synchrotron processes. AMI has been used to carry out a survey of a number of northern-sky supernova remnants. A new supernova remnant was also discovered using archive data from the VLA, which was followed up with AMI and VLA observations. This allowed the measurement of its spectral index and its detailed morphology to be mapped. There are indications of unusual emission from the centre of the object.
Drift scanning
As the Earth rotates, the stars appear to move across the sky in a similar way to the Sun. To keep pointing in the direction of a particular astronomical object, a telescope must, therefore, keep moving to compensate for the effect of the Earth’s rotation. The technique known as ‘drift scanning’, on the other hand, uses the Earth’s rotation to map large areas of the sky with minimimal time lost to driving the telescope, which is simply pointed in a fixed direction – data is collected as the sky drifts past.
In order to map large areas of the sky, AMI is used to observed narrow strips of constant declination (the astronomical equivalent of latitude). These strips are then ‘stitched’ together to map out large areas of sky. Test patches have been mapped, in this way, using the AMI SA, including a section of the Galactic plane. We hope to use drift scanning to detect interesting objects such as ultra- and hyper-compact HII regions, which trace massive star formation and are difficult to observe at lower radio frequencies.
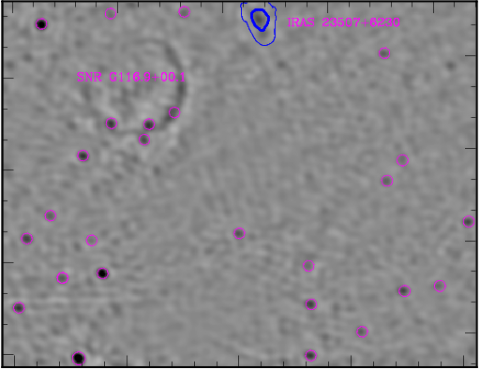
Part of the test patch of the Galactic-plane survey. The supernova remnant G116.9+00.1 can be seen as can an infra-red source, IRAS 23507+6230, which has associated carbon-monoxide emission. Magenta circles indicate the position of sources with counterparts in the NVSS catalogue